Trends
Trending is a nice feature when you want to see how a points value changed over time. This is only possible using matplotlib directly in Jupyter. And also in the Web Interface using Bokeh [http://bokeh.pydata.org/en/latest/] which brings a complete set of wonderful features for visualizing point histories (a.k.a. trends). The best feature of all - the ability to see Live Trends of your data as it occurs.
Matplotlib
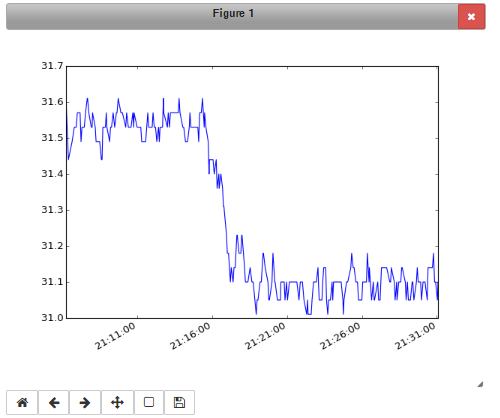
Matplotlib is a well known data plotting library for Python. As BAC0’s historical point data are pandas Series and DataFrames, it’s possible to use Matplotlib with BAC0. i.e. Showing a chart using matplotlib:
%matplotlib notebook
# or matplotlib inline for a basic interface
controller['nvoAI1'].history.plot()
Seaborn
Seaborn is a library built over Matplotlib that extends the possibilities of creating statistical trends of your data. I strongly suggest you have a look to this library.
Bokeh
Bokeh is a Python interactive visualization library targeting modern web browsers for presentation. Its goal is to provide elegant, concise graphics, with high-performance interactivity over very large or streaming datasets. Bokeh can help anyone who would like to quickly create interactive plots, dashboards, and data applications.
Note
BAC0 trending features use Bokeh when running in “complete” mode. This requires the user to have some libraries installed :
- bokeh
- flask
- flask-bootstrap
- pandas
- numpy
Note
Running in “complete” mode may be hard to accomplish if you are running BAC0 on a Raspberry Pi. If doing so, I strongly recommend using the package berryconda which will install everything you need on the RPi to use Pandas, numpy… already compiled for the RPi.
A simple call for “conda install bokeh” will install the package.
A web interface
To simplify the usage of the live trending feature, BAC0 implements a Web Server (running with Flask). Connect to http://localhost:8111 and you will get access to a Dashboard and the Trends page.
Internally, BAC0 will run two servers (flask and a bokeh server) that will handle the connection to the web interface and provide the web page with a live trend of the charts that have been sent to the interface.
Add/Remove plots to Bokeh
At first, the web page will be empty and no trend will appear. The user needs to specify which points must be trended. Points to trend are added to a list monitored by the “network” object. This will allow to add trends coming from multiple controllers easily
#each point can be added
controller['nvoAI1'].chart()
#or we can add them using the "network" object
bacnet.add_chart(controller['nvoAI1'])
# TrendLog object can also be added
trendlog_object.chart()
The list of trended points can be retrieve
bacnet.trends
#will give a list of all points added
To remove points
#on the point directly
controller['nvoAI1'].chart(remove=True)
bacnet.remove_chart(controller['nvoAI1'])
Bokeh Features
Bokeh has an extensive set of features. Exploring them is beyond the scope of this documentation. Instead you may discover them yourself at [http://www.bokehplots.com]. A couple of its features are highlighted below.
Hover tool:
And a lot of other options like pan, box zoom, mouse wheel zoom, save, etc…:
By default, x-axis will be a timeseries and will be linked between trends. So if you span one, or zoom one, the other plots will follow, giving you the eaxct same x-axis for every plots.
Bokeh Demo
Here is a working demo of Bokeh. It’s taken from a real life test. You can use all the features (zoom, pan, etc.) Please note that the hover suffers from a little bug in this “saved” version of the trends… Working to solve this.